Our Progress in reducing CO2
We have already enabled an estimated 2.2% reduction in ATM CO2 emissions across our airspace including En-Route, Airport and Oceanic operations.
This reduction equates c. 170,000 tonnes of fuel per annum against our 2006 baseline, enabling savings of c. £110m each year to airline customers (based on £650 per metric tonne of fuel).
Specific Progress in 2013/14
Our main focus over the last year has been the ‘4% Plan’ project, a programme of activities established to deliver additional short-term flight efficiency measures to achieve NATS interim 4% target, due by the end of 2014. The focus of this project, which started in 2012, has been to bring forward to implementation additional fuel and emissions saving measures, or speeding-up delivery of existing projects, originally planned to deliver after 2014. We’re now fully in delivery mode, and accelerating the pace. For example, the last year saw over 75 specific fuel saving changes delivered whereas in previous years this has averaged around 30.
These changes helped us to deliver the biggest annual savings to fuel burn and CO2 emissions since the programme begun: we enabled fuel savings of 36,000 tonnes equivalent to 114,000 tonnes of CO2 worth £23m to our airline customers.
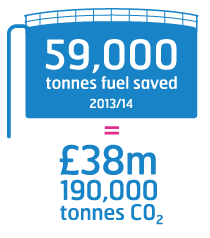
During the year improved analytical techniques have allowed us to assess for the first time benefits of airspace efficiency measures and past projects. We are now able to capture the benefits delivered tactically on-the-day by our front-line operational staff such as the impact of greater sharing of airspace with our military counterparts and continuous climbs and descent operations. Taking these into account for 2013/14 total enabled fuel savings were 59,000 tonnes, equivalent to 190,000 tonnes of CO2, worth £38m.
The annual profile of delivery is as follows:

Click to enlarge
Capturing the Full Picture of Benefits
We reported last year that we had not been able to capture all the fuel saving benefits delivered since our programme began and that we were exploring means of capturing these through the use of technology, for example, using 3Di and the Flight Profile Monitor tools. Over the past year we have been able to close this gap by understanding further areas where we have delivered positive changes. As mentioned previously we are now able to capture the impact of enhanced airspace sharing with our military counterparts, and improvements to continuous climbs and continuous descent operations, all areas showing savings in absolute terms since our 2006 baseline. These, along with other smaller improvements have changed the profile of the cumulative savings and helped increase overall savings in the last year. This information has enabled us to update the profile of benefits delivered since the programme began, shown in the table below:

Click to enlarge
The above table expresses benefits enabled based on when projects actually delivered change (when benefits were enabled) rather than when projects been formally claimed benefits, which often happens some time after delivery. As such the above table provides the most robust estimate of NATS benefits delivery profile. NATS cumulative assessments have been based upon this profile.
It is also acknowledged that our airspace efficiency assessments lag the delivery of airspace improvements. For example, whilst we currently estimate that we have achieved a 2.2% reduction in ATM CO2 emissions (vs. 2006) we have a number of assessments outstanding from airspace efficiency initiatives delivered last year which may improve this estimate based on the same period. With this in mind we will report on progress against our 4% target in next year’s annual corporate responsibility report, expected early summer 2015. Lastly, we typically present our performance data in this report by aggregating together individual emissions assessments of specific changes, with the sum of all projects representing total fuel and CO2 savings delivered. This is called a project based delivery approach to assessing target achievement. In addition, when we report progress against our 4% target, we will be demonstrating our progress using a range of ‘out-turn’ metrics. These metrics are based on empirical data and will demonstrate the observed or measured change in performance across NATS airspace.
Cumulative Fuel Saving since 2006
These compound annual savings really add up over time. Looking at the cumulative fuel burn savings enabled since 2006, this amounts to over 1.3 million tonnes CO2 (414,000 tonnes of fuel) and £270 million in reduced fuel costs to our airline customers. These figures have been calculated by adding the annually delivered savings up over time – for conservatism benefits have only been counted for the year after delivery, whereas in reality it would be expected that benefits would accrue within the year of delivery also. For example 2013/14 savings will only be counted next year.

Click to enlarge
3Di Performance
3Di is unique in that it provides meaningful and credible ways of measuring actual performance, to give our airline customers proper insight into the level of flight efficiencies we are delivering for them.
As such, the 3Di metric essentially supports achievement of our strategic target by incentivising us to focus on making structural and tactical improvements to our operations that deliver fuel burn and CO2 performance improvements.
For the 2013 calendar year NATS delivered more than the CAA’s 3Di target with a score of 23.7 points, a 0.3 point improvement against the 24.0 target value set. This is the second year running that we have achieved our regulatory 3Di target. This year the 3Di gets harder to achieve with a par value set at 23.0.
Delivery Against OPA Near-Term Targets
The Operational Partnership Agreement (OPA) has a specific focus on near-term fuel savings and sets challenging targets annually to drive joint flight efficiency initiatives with our customers. Most of the changes made by these OPA initiatives take the form of flight plannable direct routes or improvements to our ATC procedures that reduce fuel burn.
In 2013/14 we set targets to enable 12,000 tonnes of fuel (18,000 tonnes fuel stretch). We enabled savings just beyond the stretch target of 18,000 tonnes fuel. For the period April 2014 until the end of the calendar year, marking the end of this regulatory Control Period, we have agreed a new target of 5,000 tonnes fuel, with a stretch of 10,000 tonnes.